Clixtell
A SaaS dashboard redesign helping marketers detect click-fraud and protect PPC budgets. Real-time analytics built for campaign decisions.

At a Glance
Led end-to-end UX and UI design for a SaaS analytics dashboard - from client research and problem definition through wireframing, high-fidelity design and usability testing with real users in the US and Israel.
Client research insights, user personas, problem statement, digital wireframes, high-fidelity dashboard UI, interactive prototype, usability study results and iteration recommendations.
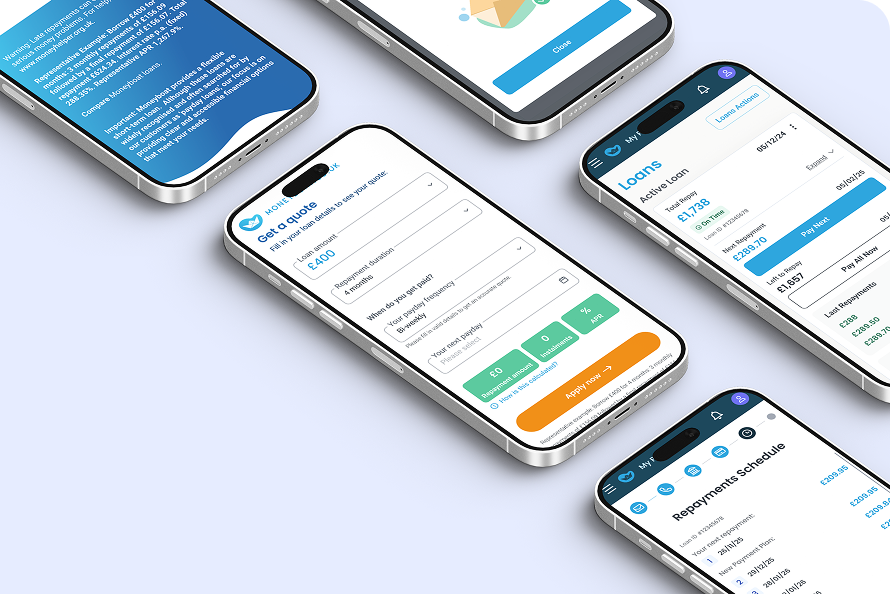
Delivered a redesigned SaaS dashboard that gave Clixtell's clients clear visibility into click fraud patterns and call tracking data - reducing cognitive load, improving task completion and enabling faster, more confident campaign decisions.
Challenge
Clixtell's clients were losing real ad budget to click fraud without realizing it and the existing dashboard wasn't giving them the tools to fight back. Data was hard to parse, key actions were buried and users couldn't quickly distinguish between their click fraud and call tracking services. The result: clients struggled to identify suspicious activity, manually block offending IPs and extract actionable insights from their analytics - creating frustration and eroding confidence in the platform.
Process
Results
What I Did
Conducted structured client interviews across US and Israel markets, then mapped findings to a restructured dashboard architecture - clearly separating click-fraud and call-tracking workflows. Iterated from low-fidelity wireframes to a complete high-fidelity design, validated through an unmoderated usability study with real Clixtell clients.
Research Foundation
I conducted structured interviews with Clixtell clients (ages 27-44, US and Israel markets) to understand how they actually used the dashboard day-to-day. Six questions covered service usage, analytics value, workflow challenges and specific friction points.
Key Questions:
- What do you find most valuable and least valuable about the dashboard?
- Which services do you use - click fraud detection, call tracking, or both?
- How useful are the analytics and reporting features for your organization?
- What kind of insights do you gain from the analytics?
- What challenges do you face when using the dashboard?
- Are there specific tasks that you find difficult to understand or complete?
Personas

"Our clients trust us to protect their ad spend and deliver results and we need reliable tools to ensure that. Fraud detection is critical for maintaining client confidence and demonstrating the value of our services."
- • Deliver high-performing ad campaigns for clients.
- • Ensure transparency and trust by preventing click fraud.
- • Maintain client satisfaction and retention.
- • Balancing the need for detailed analytics with reporting for clients.
- • Ensuring robust fraud protection across different ad platforms.
- • Pressure to deliver ROI and protect clients' ad investments.

"I need to ensure every dollar spent on ads is reaching potential customers, not bots. Real-time data and actionable insights are crucial for optimizing our marketing strategy."
- • Maximize ROI on ad spend.
- • Increase brand visibility and customer acquisition.
- • Ensure campaign integrity and reduce wasted ad spend.
- • High cost of fraudulent clicks.
- • Difficulty in tracking and reporting fraudulent activities.
- • Lack of real-time insights into ad performance and fraud detection.

"I need a tool that consolidates data from all our ad platforms and flags potential fraud automatically. Our marketing strategies rely on accurate, real-time data to stay ahead of the competition."
- • Provide data-driven insights to optimize ad performance.
- • Detect and prevent fraudulent activities in real-time.
- • Support marketing strategies with accurate reporting.
- • Difficulty in integrating data from different sources for analysis.
- • Manual processes to identify fraudulent activities.
- • Pressure to deliver quick insights to support decision-making.

"I need simple, clear insights to know my ads are working and not being wasted. As a small business, every dollar counts. I can't afford to lose money to fraud."
- • Increase foot traffic to the store.
- • Improve online presence and lead generation.
- • Efficiently manage a limited advertising budget.
- • Confusion about how to identify and prevent click fraud.
- • Understanding complex dashboards.
- • Concerns about wasting money on ineffective ads.
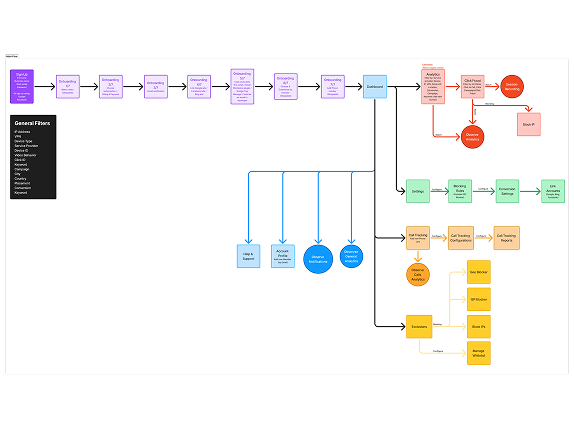
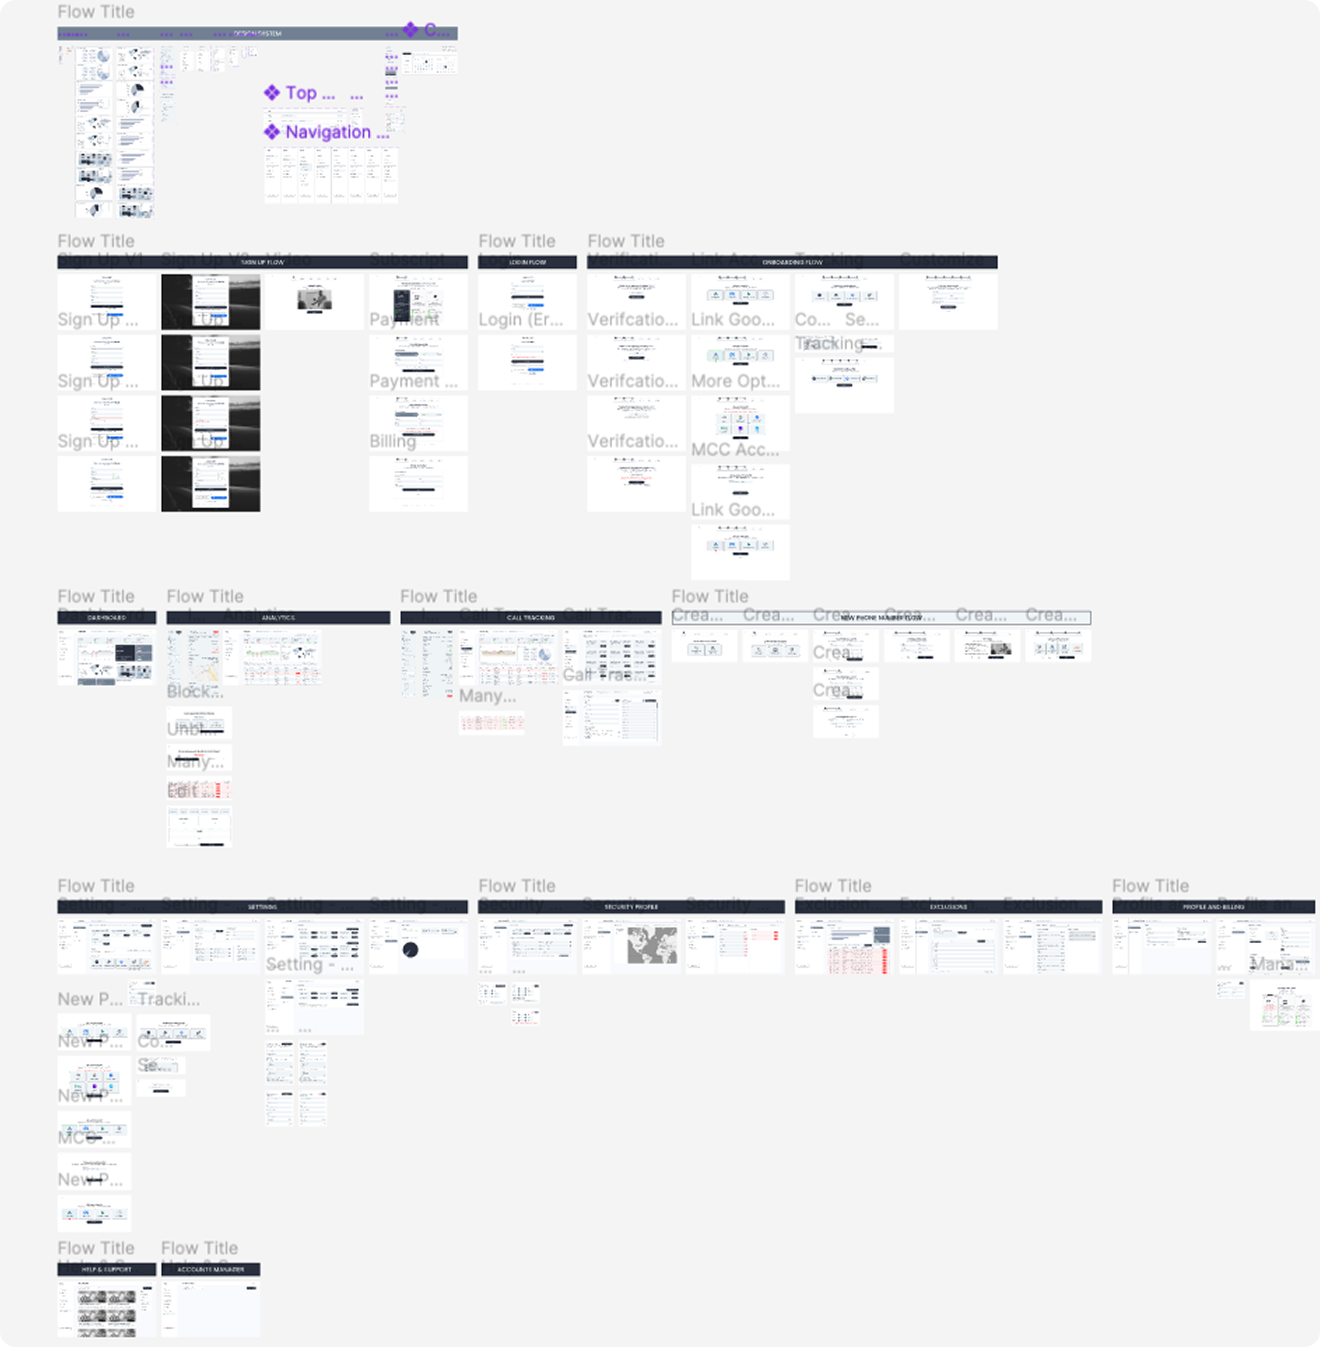
User Flow
Mapped the end-to-end journey for Clixtell's two core services: click-fraud protection and call tracking, to expose where users lost context, made wrong turns or hit dead ends. The flow became the foundation for restructuring the dashboard's information architecture and navigation logic.
Problem Statement
Clixtell's clients need a dashboard that clearly separates service data, surfaces suspicious activity immediately and enables confident action - without requiring them to dig through cluttered analytics to find what matters.
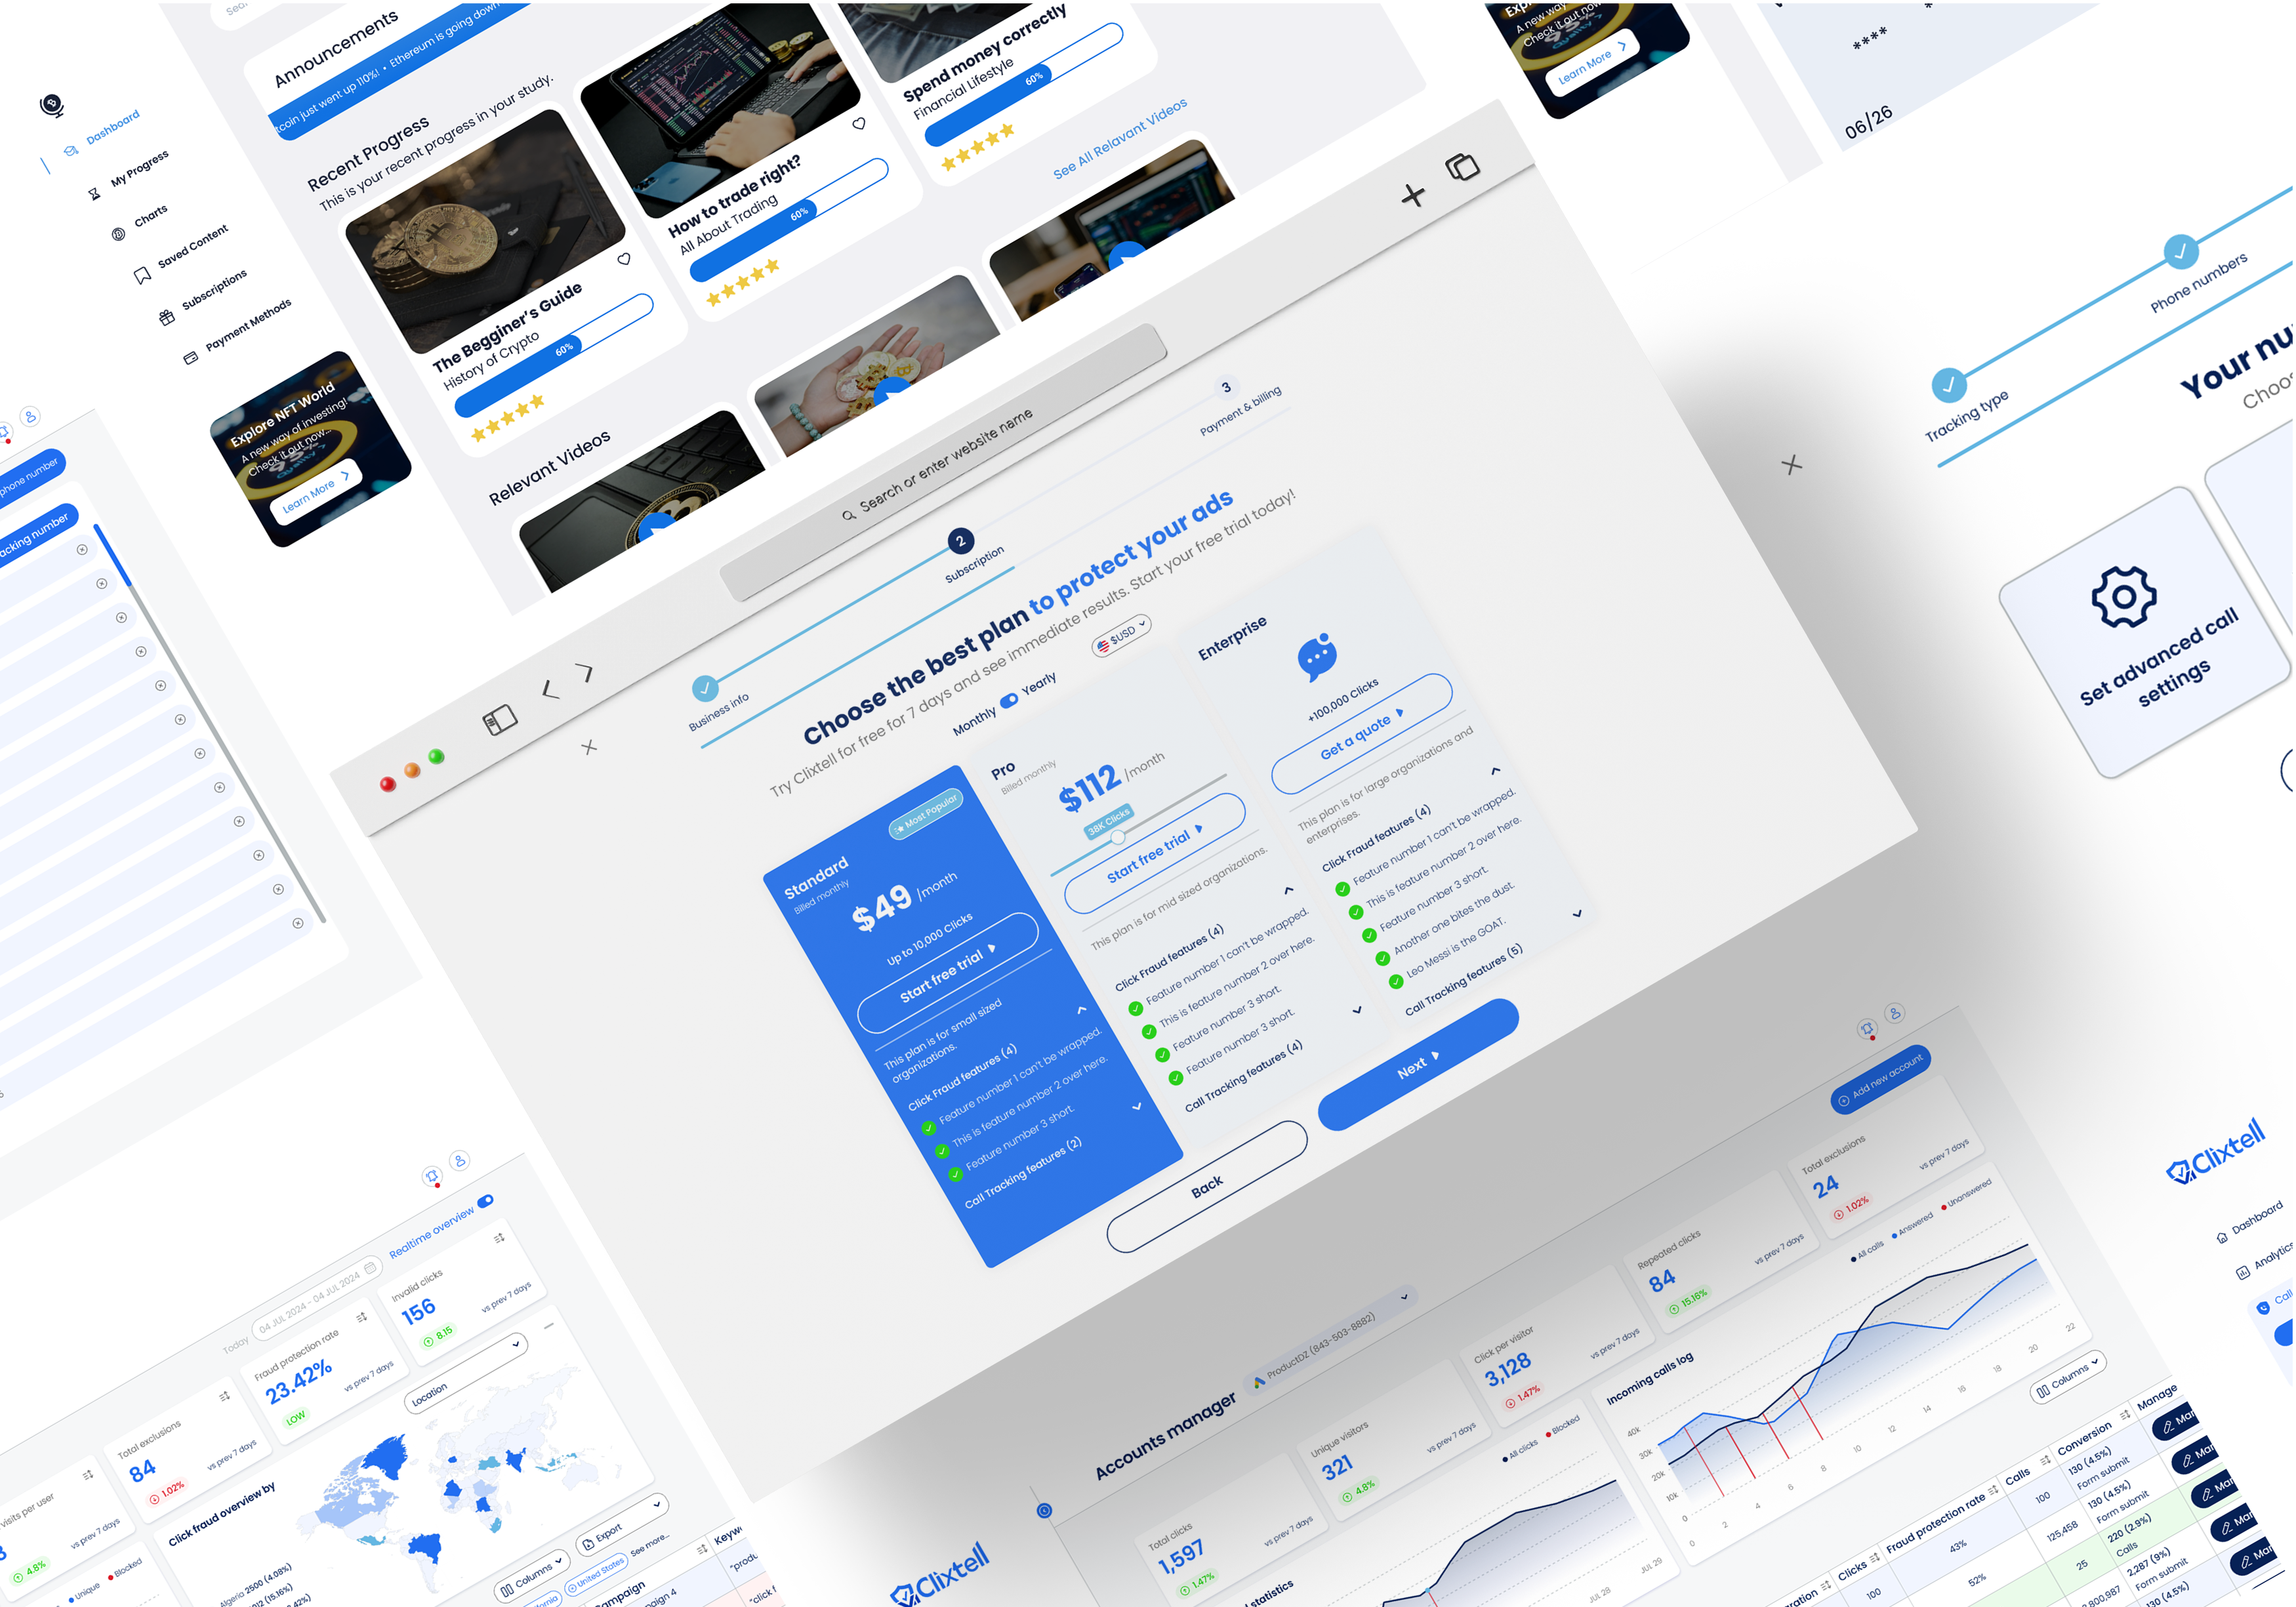
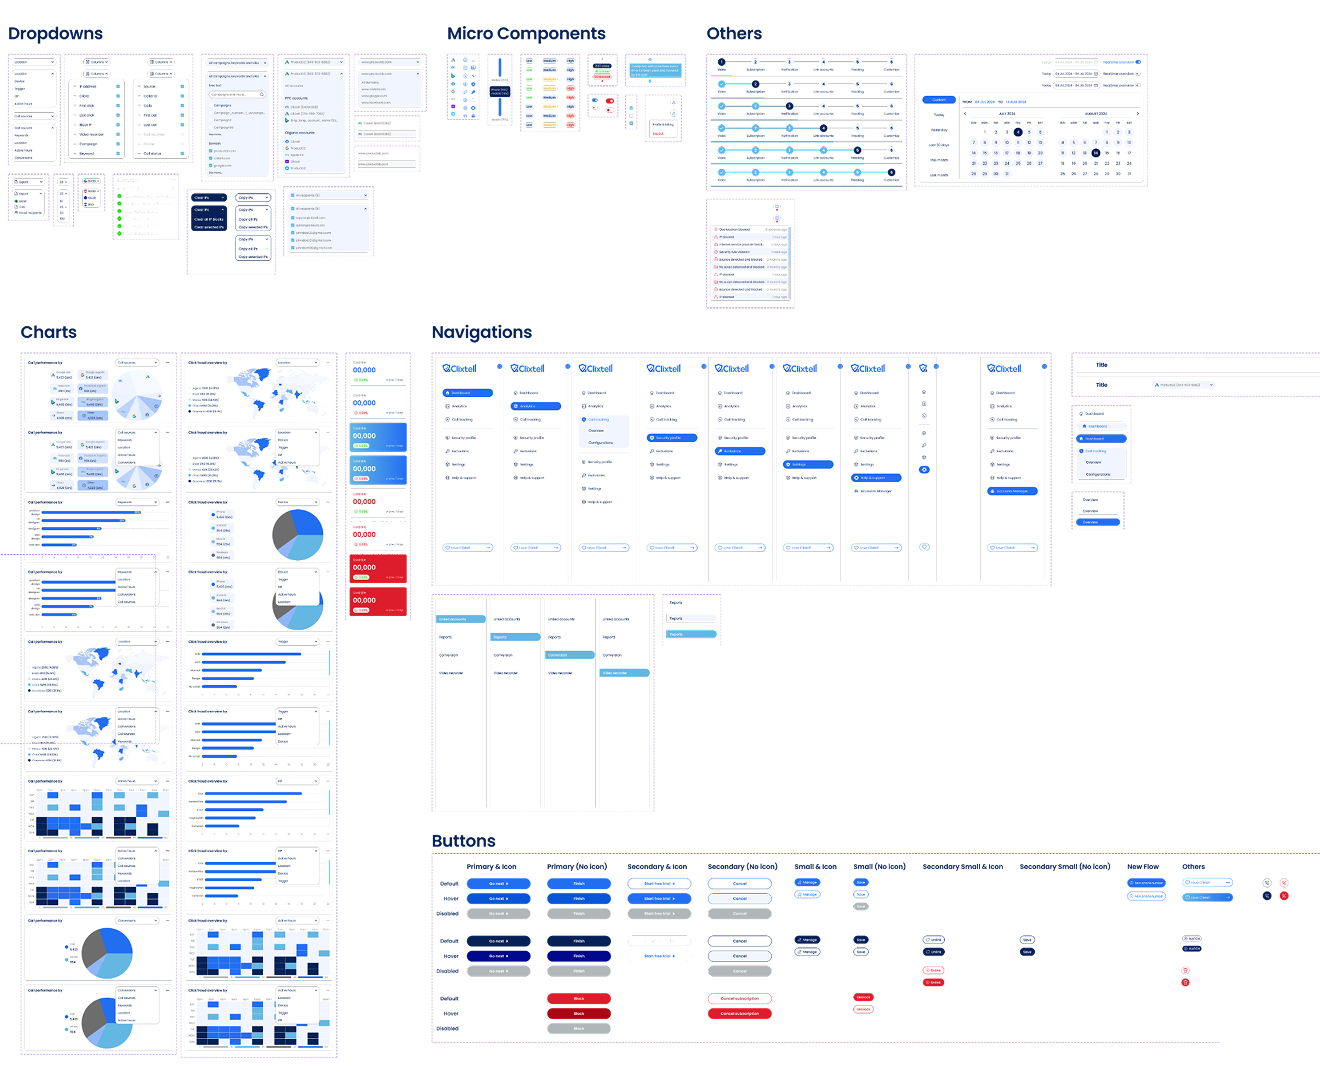
Solution
Sketched and iterated on page-by-page structure across the dashboard. After team brainstorming sessions, aligned on a new information architecture that clearly separated click fraud and call tracking workflows and prioritized the most-used analytics views.
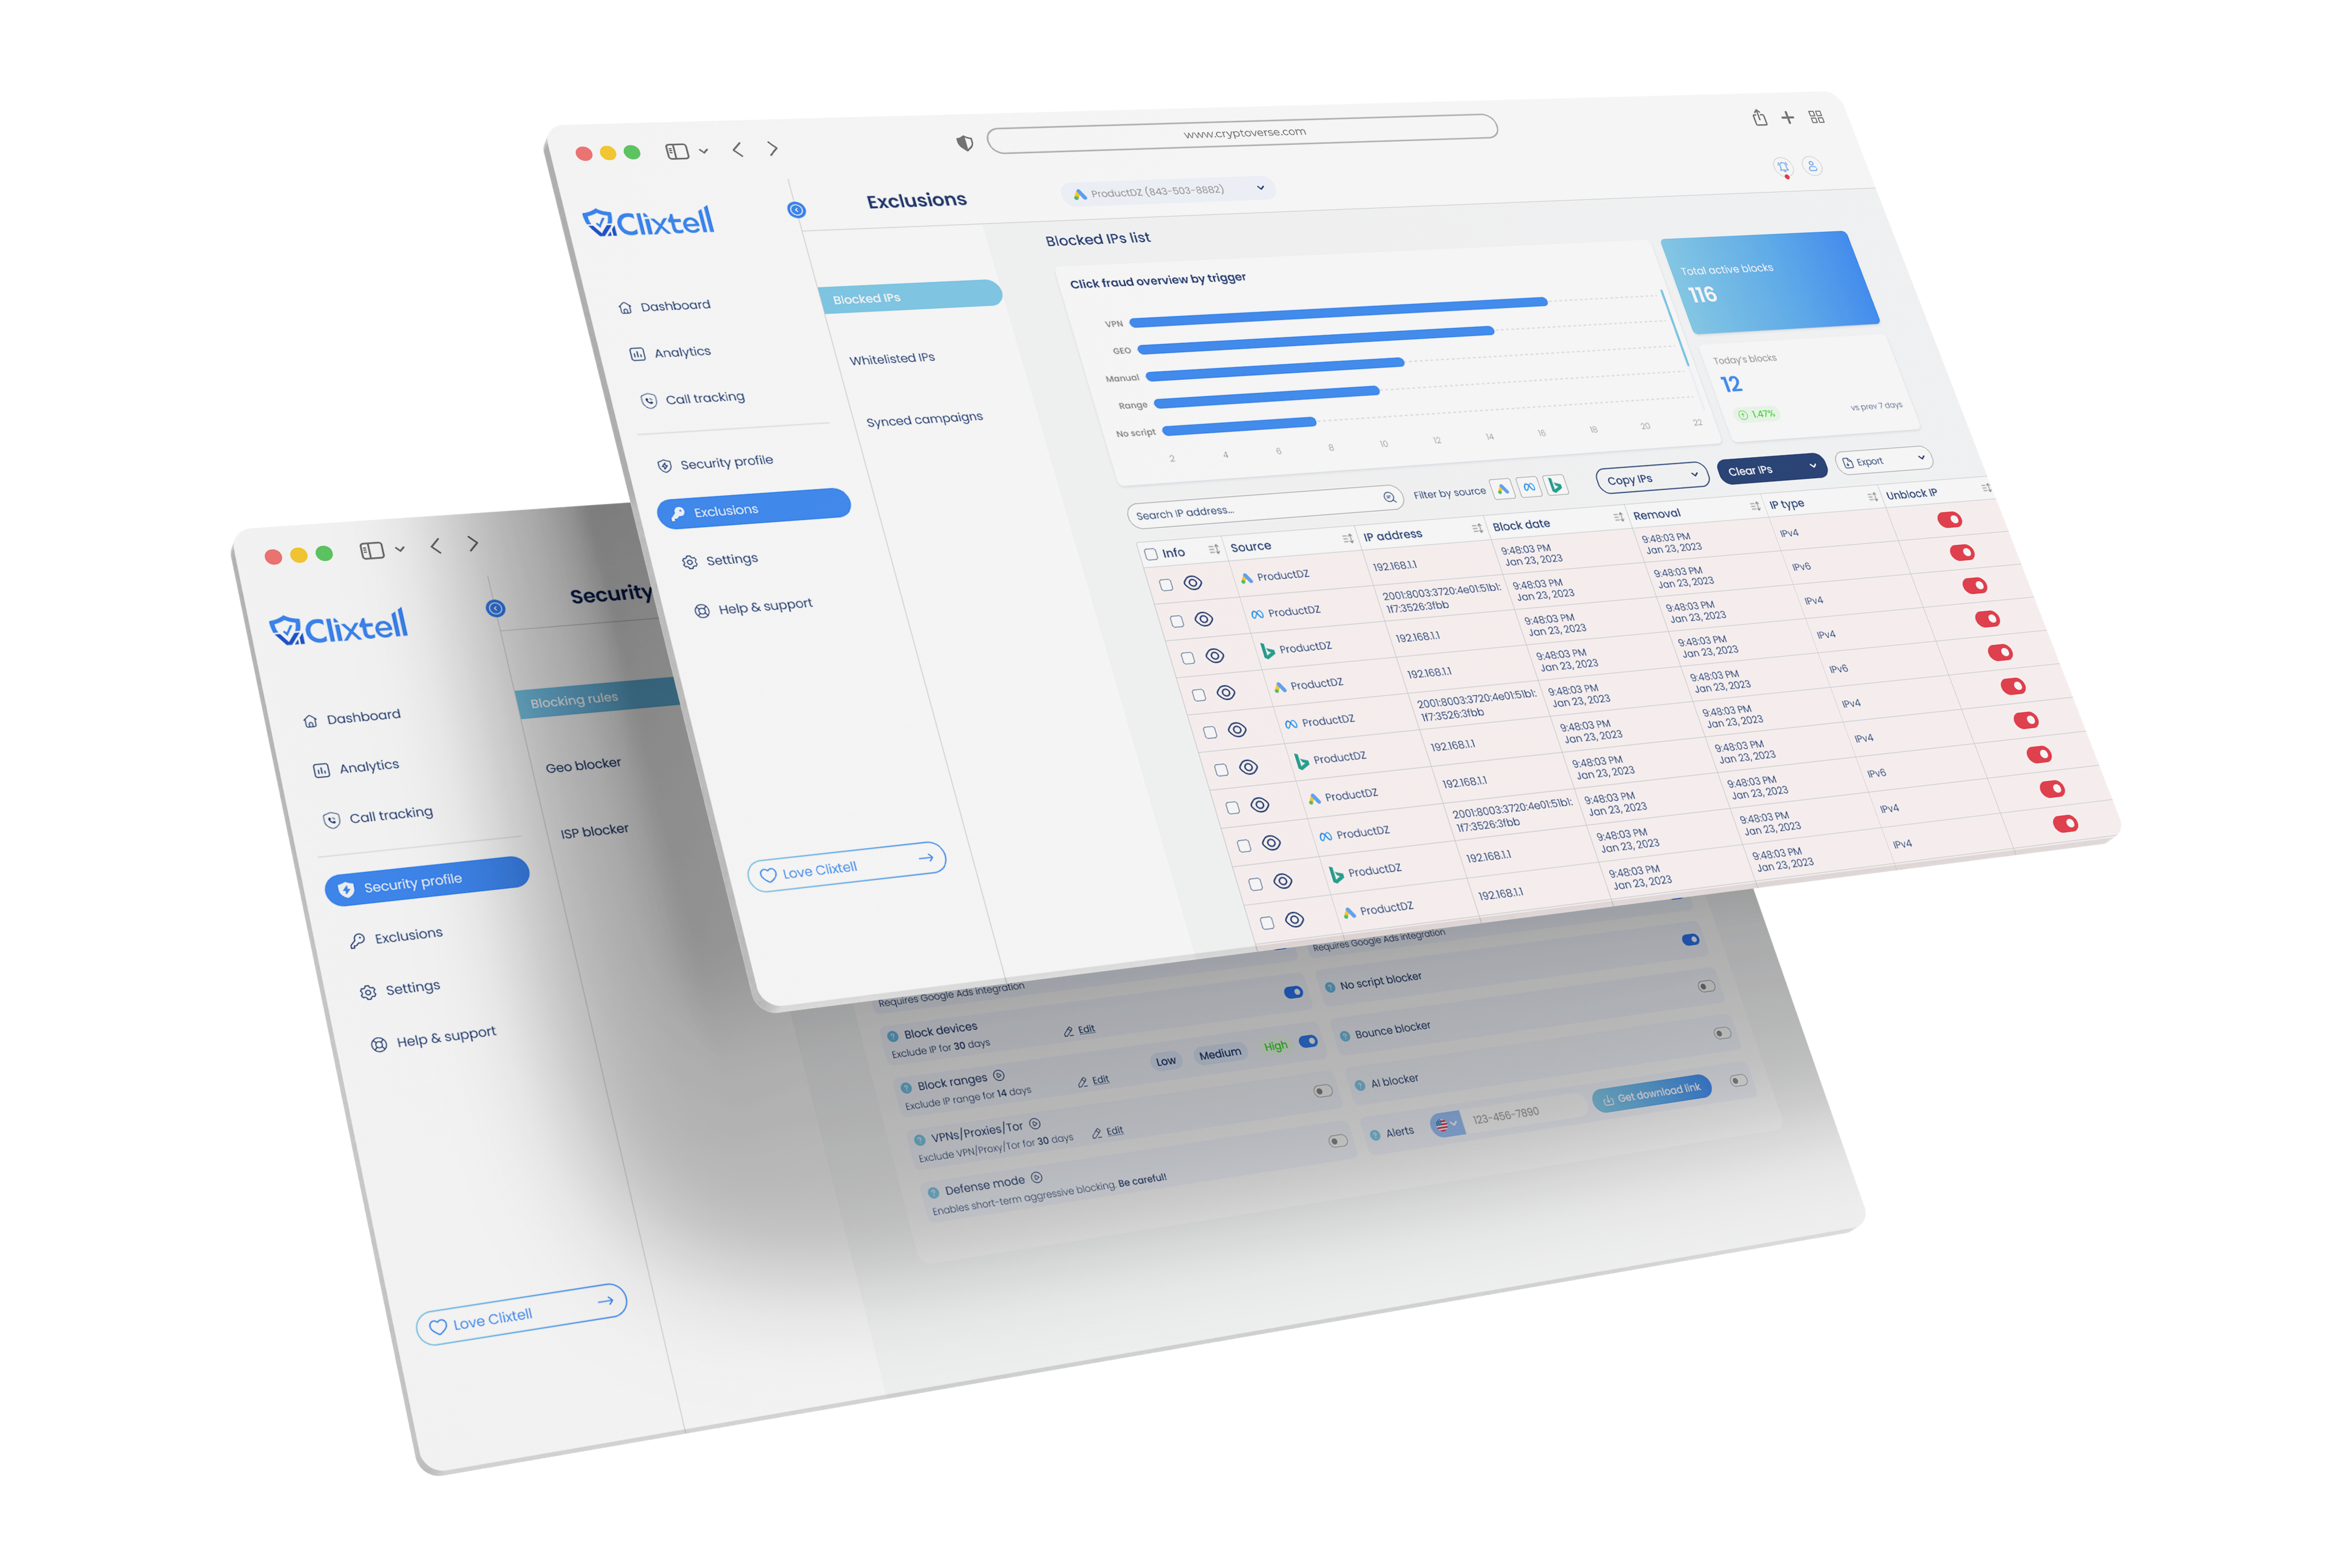
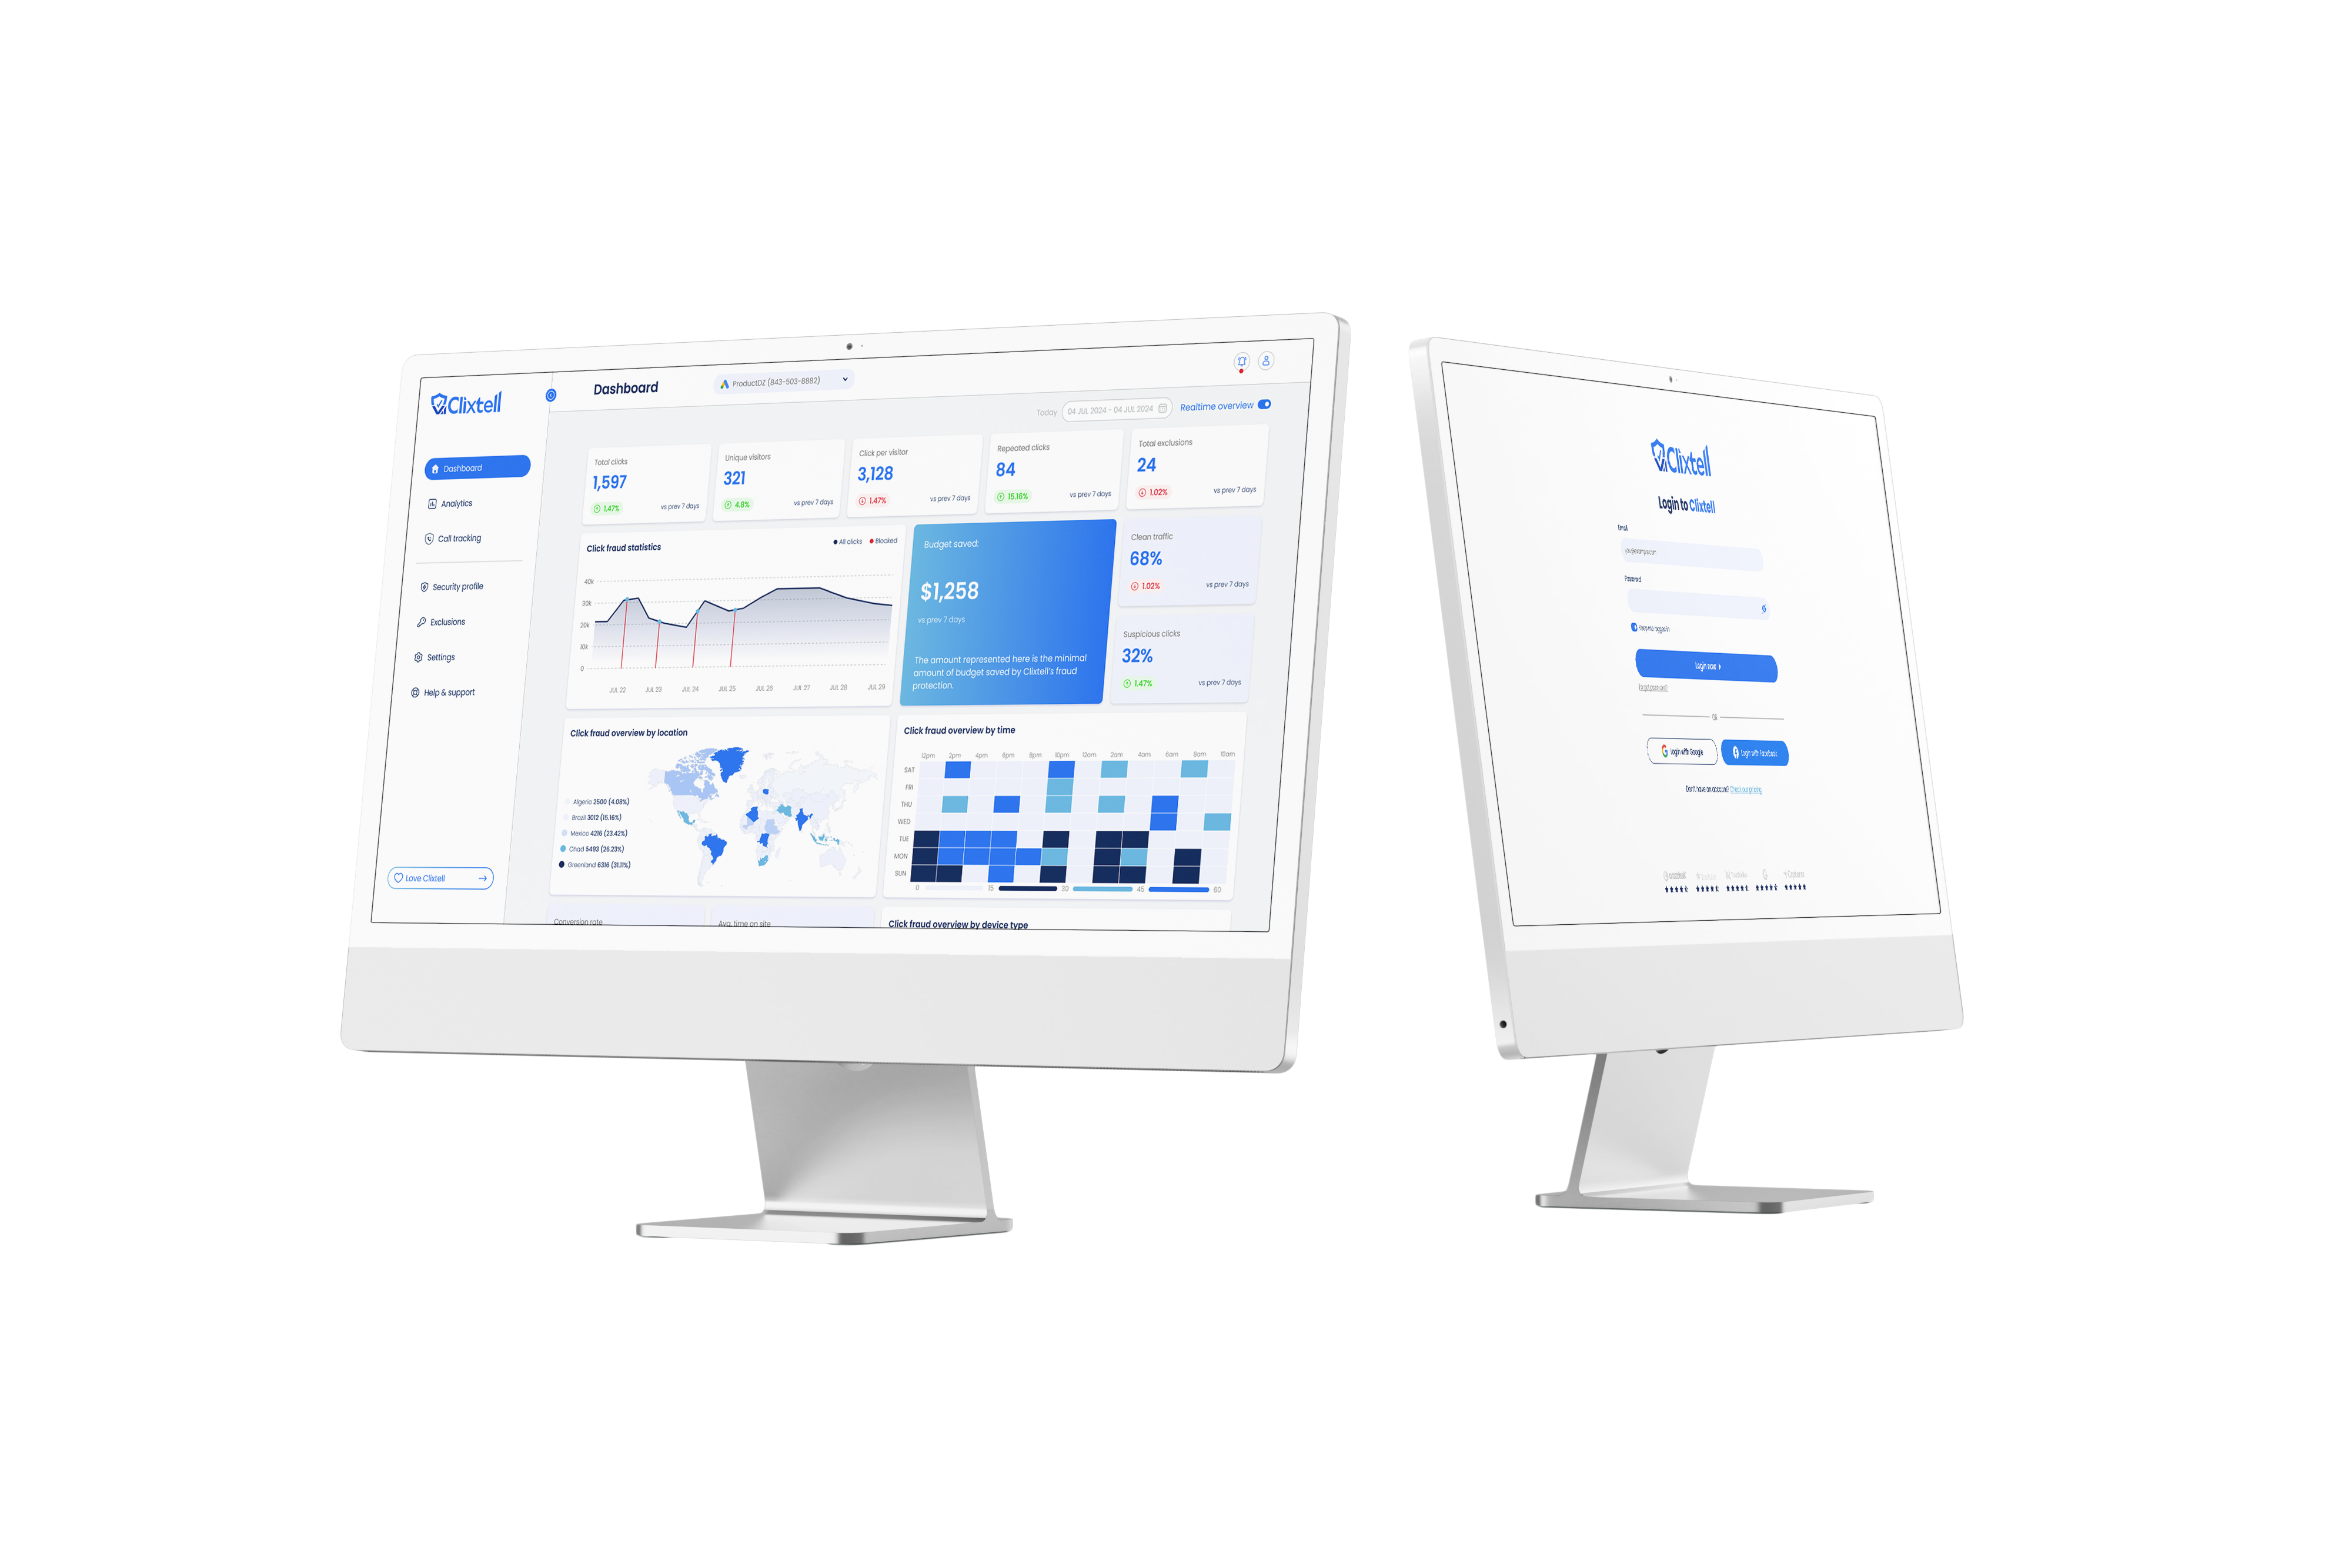
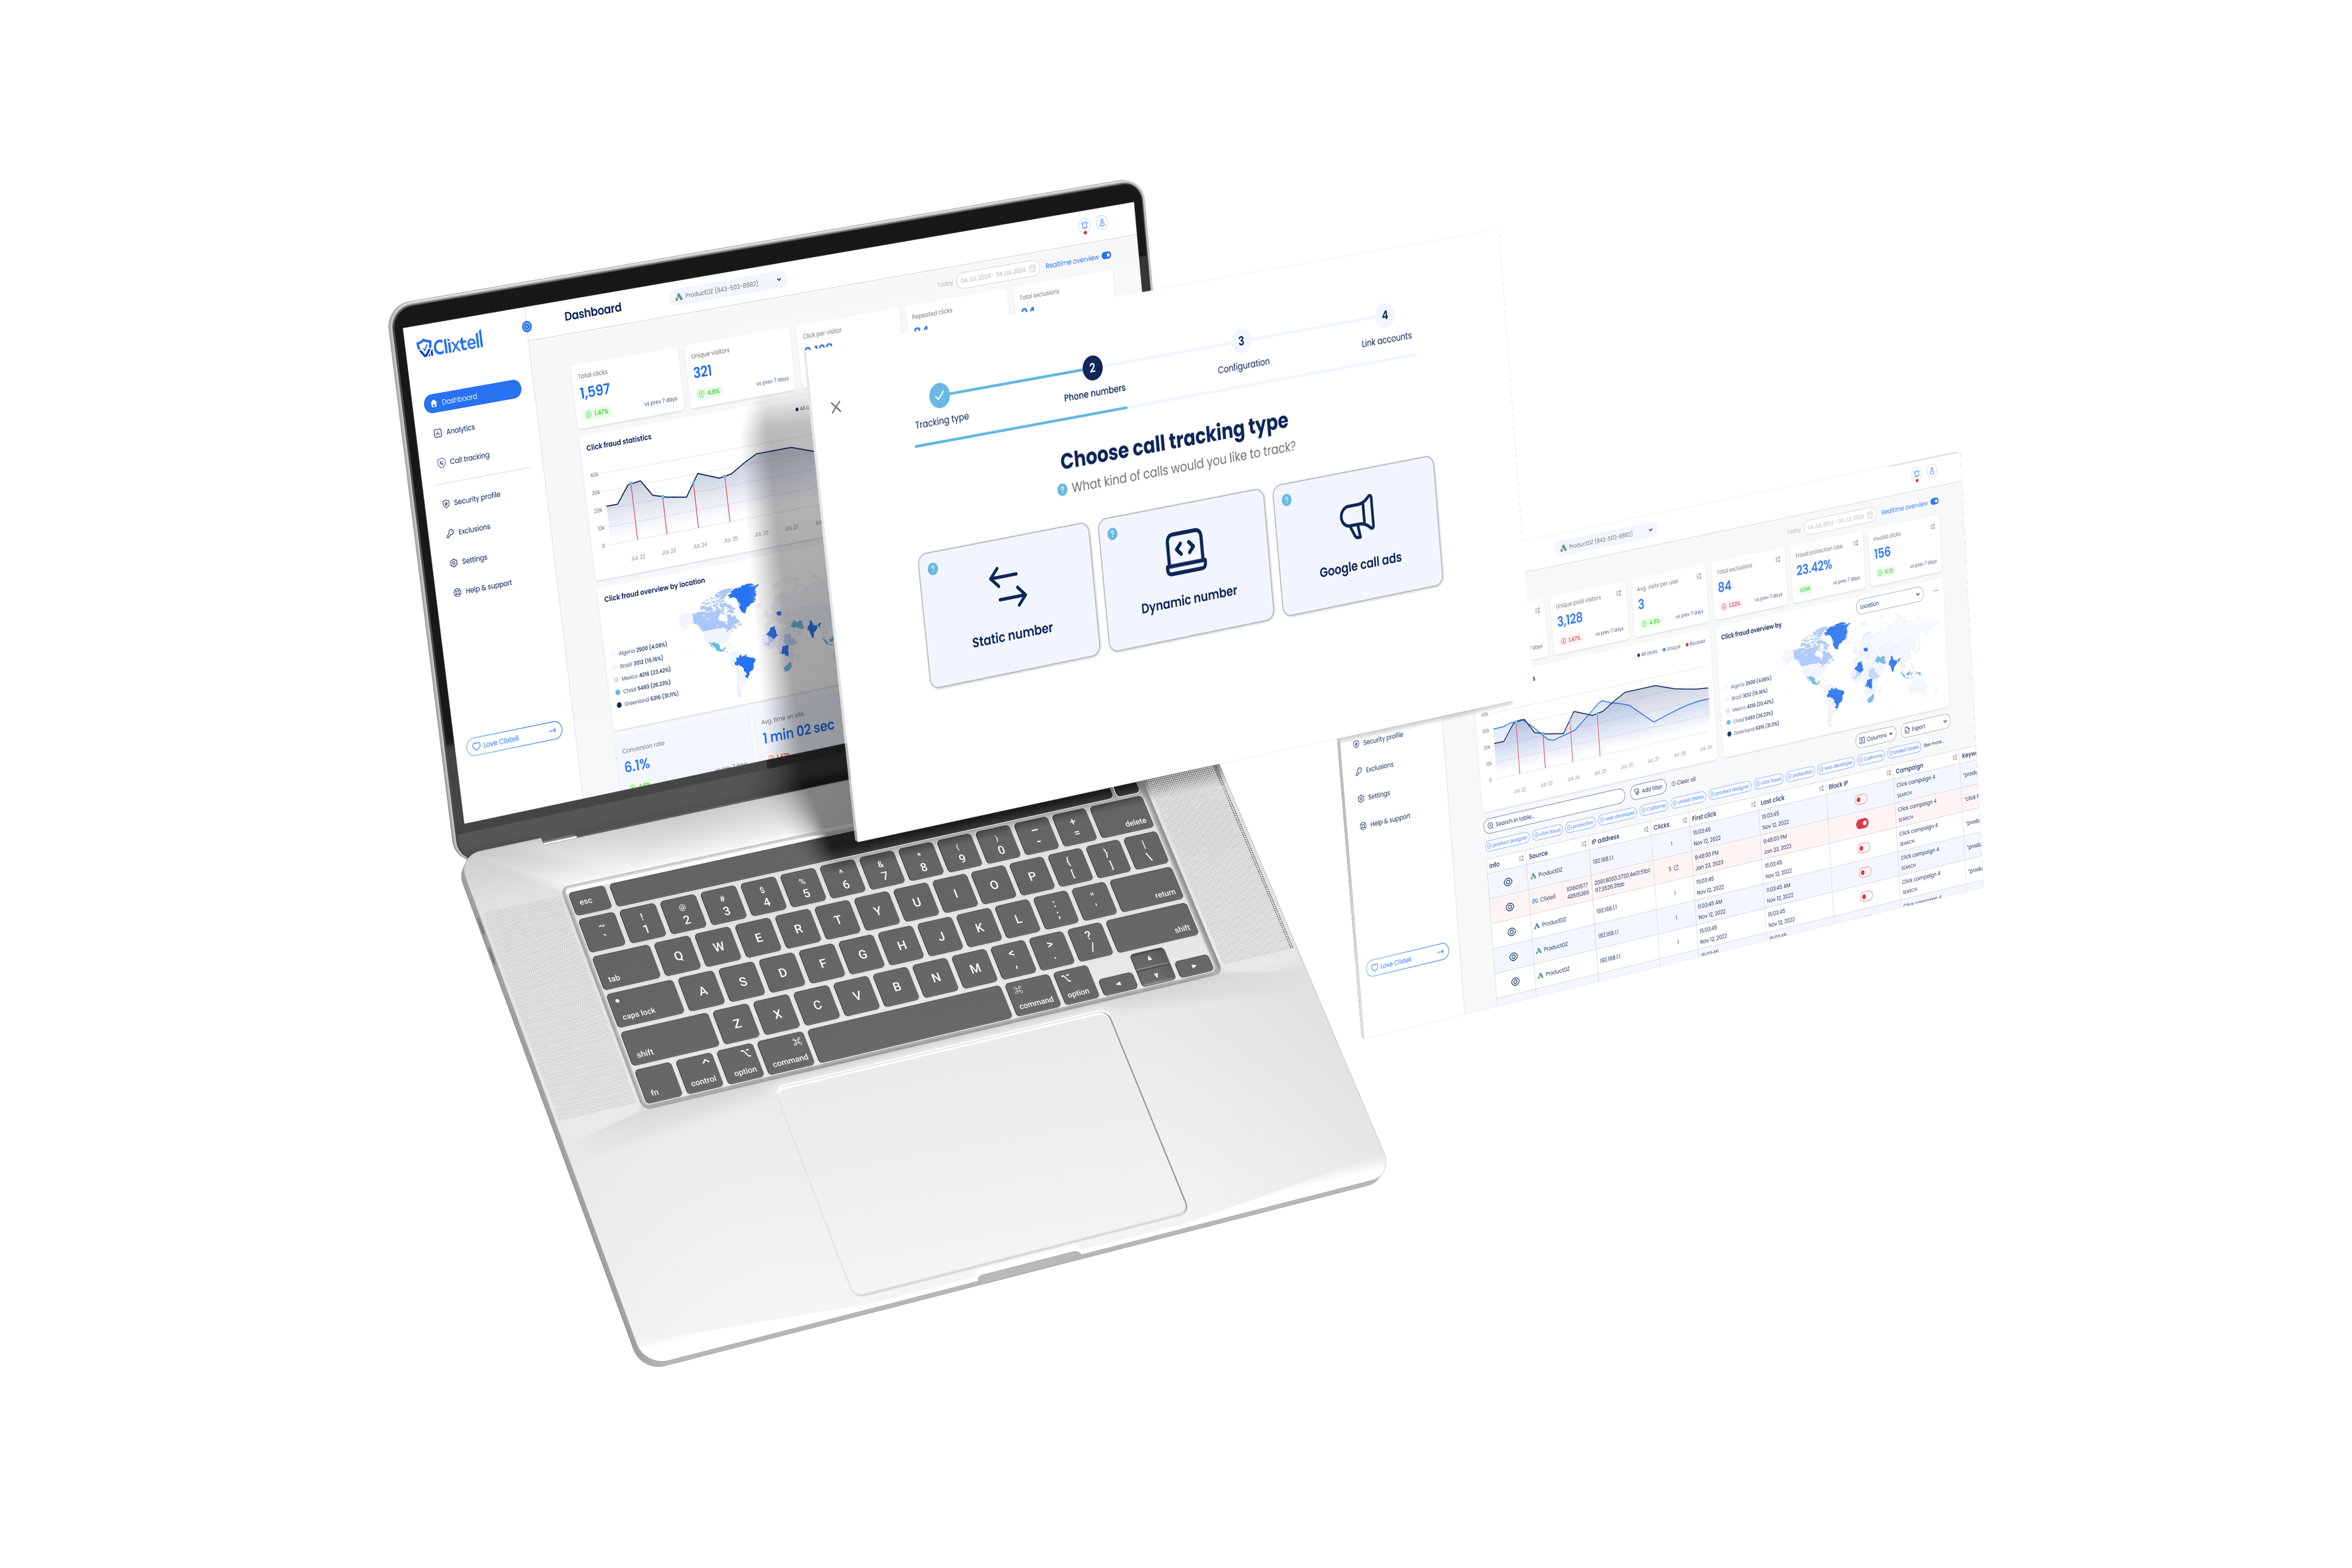
The final UI brought clarity to a data-heavy product - clean separation between services, a hierarchy that surfaces critical alerts first and an interface that lets marketers act fast without needing to interpret raw data. Designed for PPC professionals who live in dashboards daily.
User Testing
I defined the usability tasks, success metrics and study framework for the project and executed the user testing into insights identification and design iteration.
Participants: 5 participants, ages 27–44.
Methodology: Moderated usability study on a high-fidelity prototype, 15–20 minutes per participant, remote, US & Israel.
Core Tasks:
- In the dashboard, filter data to show only click fraud service results
- Identify a suspicious IP and manually block it
- Find the most-used trigger for blocking clicks
- Switch between accounts to view different campaign data
Success Metrics:
- Task success rate - % of participants who completed each task
- Task completion time - time taken per task
- System Usability Scale (SUS) - overall usability score post-testing
Impact
More Projects